Zhou Muzhi: Identify Beijing's path to carbon peak and neutrality by benchmarking against four major metropolises


1. Beijing's carbon dioxide emissions increase 250 percent in two decades
Beijing's carbon emissions grew rapidly over 20 years to a huge amount. Compared with the four major metropolises, Beijing stood out in both the growth rate and the amount of carbon emissions.
(1) Beijing's amount of carbon dioxide emissions far exceeds those of the four major metropolises
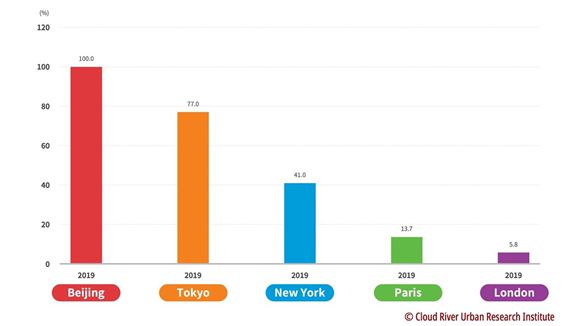
Among the five megalopolises, Beijing was the largest carbon dioxide emitter.
The emissions of Tokyo and New York megalopolises were only 77 percent and 41 percent of those of Beijing, respectively, while those of Paris and London megalopolises were even smaller — only 13.7 percent and 5.8 percent of those of Beijing, respectively. Compared with the four major metropolises, Beijing stood out in terms of emission amount.
Figure 3 Comparison between Beijing and the 4 major metropolises in terms of the amount of carbon dioxide emissions
(2019)
(2) Beijing's carbon dioxide emissions grow rapidly over two decades
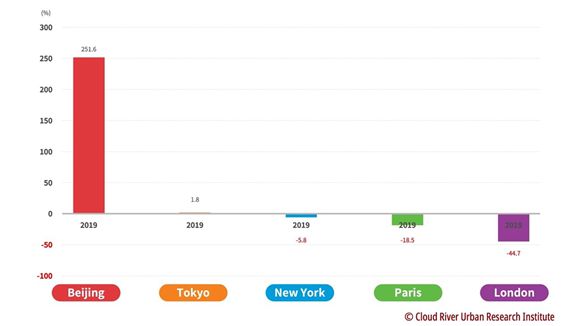
Beijing's carbon dioxide emissions grew rapidly by 250 percent over the two decades from 2000 to 2019.
During the same time, among the four major metropolises, London, Paris, and New York megalopolises all saw their carbon dioxide emissions decrease, and merely Tokyo saw a slight increase.
Tokyo megalopolis saw its carbon dioxide emissions increase by 1.8 percent during that period. It was mainly because the nuclear power accident in March 11, 2011 resulted in a shutdown of all nuclear power plants (accounting for 40 percent of Japan's total power generation), and thus a significant increase in the proportion of thermal power generation. Even under those circumstances, Tokyo managed to limit its carbon dioxide emissions to a slight increase. That was not easy, especially when its population grew 9.9 percent during that period.
During the same period, the population of New York megalopolis grew by nearly 10 percent, and its economy doubled in size, while its carbon dioxide emissions fell by 5.8 percent. Paris megalopolis also brought down its carbon dioxide emissions by 18.5 percent, while its population and economy grew by 10.4 percent and 34.4 percent, respectively. London megalopolis saw a 24.8 percent increase in population and a 55.7 percent economic growth, but cut its carbon dioxide emissions by 44.7 percent.
The above analysis shows that efforts of the four major metropolises to reduce carbon dioxide emissions in the 21st century turned out to be effective.
Figure 4 Comparison between Beijing and the 4 major metropolises in terms of the amount change of carbon dioxide emissions
(2000-2019)
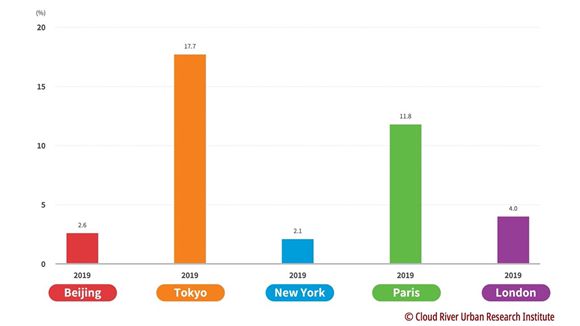
(3) Beijing's carbon dioxide emissions account for 2.6 percent of China's total
Among the five megalopolises, Tokyo megalopolis ranked first in terms of the proportion of local carbon dioxide emissions in the national total with a percentage of 17.7 percent, Paris megalopolis ran behind with 11.8 percent, and that of London megalopolis was 4 percent.
Japan, France, and the UK highly concentrated its economy in the capital economic circle, with Tokyo, Paris, and London megalopolises contributing 33.1 percent, 32.4 percent, and 23.6 percent, respectively, to their national economy. In comparison, carbon dioxide emission shares they contributed to the national total were much lower, an obvious advantage in energy conservation and emission reduction.
Compared with Japan, France, and the UK, the US and China have a vast territory, a large population, and relatively scattered economic hubs. As a result, New York and Beijing megalopolises contributed merely 8.8 percent and 3.6 percent, respectively, to their national economy, and took up only 2.1 percent and 2.6 percent, respectively, in national carbon dioxide emissions.
Figure 5 Comparison between Beijing and the 4 major metropolises in terms of the share of carbon dioxide emissions in the national total
(2019)


- China moves to set national standards for pre-made dishes
- Chinese company unveils plans for commercial space flights
- Latest addition to Shiziyang Bridge constructions brings main tower above 300 meters
- Hebei's 'ancient pressure cooker' setting internet ablaze
- Major urban renovation restores Xi'an's ancient moat
- China launches nationwide employment assistance program