Zhou Muzhi: Identify Beijing's path to carbon peak and neutrality by benchmarking against four major metropolises


2. Huge gaps exist between Beijing and the four major metropolises in terms of carbon dioxide emissions per unit of GDP
Carbon dioxide emissions per unit of GDP, also known as "carbon intensity," measures the correlation between a country's or a city's economy and carbon emissions.
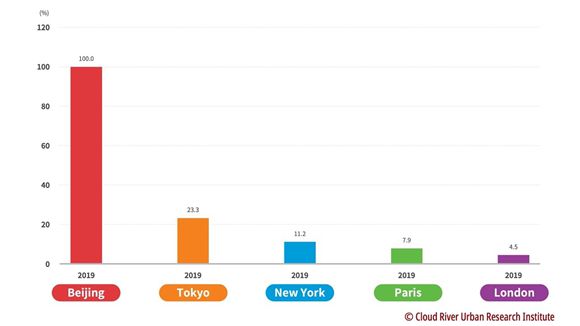
(1) London's carbon dioxide emissions per unit of GDP are less than 5 percent of those of Beijing
Among the five megalopolises, Beijing has the highest carbon dioxide emissions per unit of GDP.
Carbon dioxide emissions per unit of GDP of Tokyo, New York, Paris, and London are 23.3 percent, 11.2 percent, 7.9 percent, and 4.5 percent of those of Beijing, with London emitting the least carbon dioxide per unit of GDP.
Even the carbon dioxide emissions per unit of GDP of Tokyo megalopolis, the highest among the four major metropolises, are less than a quarter of those of Beijing, and those of London megalopolis are less than 5 percent of those of Beijing. The aforementioned data shows that there are huge gaps between Beijing and the four major metropolises in terms of economic structure and quality.
Figure 6 Comparison between Beijing and the 4 major metropolises in terms of carbon dioxide emissions per unit of GDP
(2019)
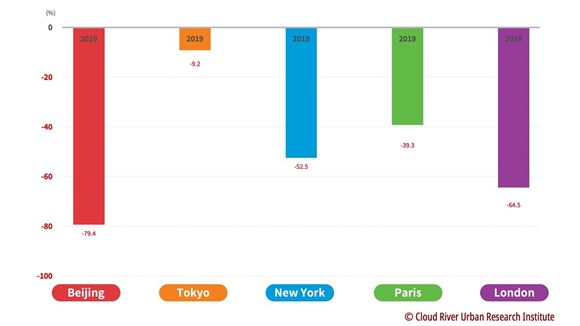
(2) Beijing's carbon dioxide emissions per unit of GDP plummet by 79.4 percent over two decades
Beijing saw its carbon dioxide emissions per unit of GDP plummeted by 79.4 percent from 2000 to 2019, the biggest drop among the five megalopolises.
The four major metropolises also made significant achievements in reducing carbon intensity during the period. New York, Paris, and London megalopolises saw their carbon dioxide emissions per unit of GDP plunge by 52.5 percent, 39.3 percent, and 64.5 percent, respectively. Even Tokyo megalopolis, which had to massively increase thermal power generation, saw its carbon dioxide emissions per unit of GDP fall by 9.2 percent.
Figure 7 Comparison between Beijing and the 4 major metropolises in terms of the change of carbon dioxide emissions per unit of GDP
(2000-2019)
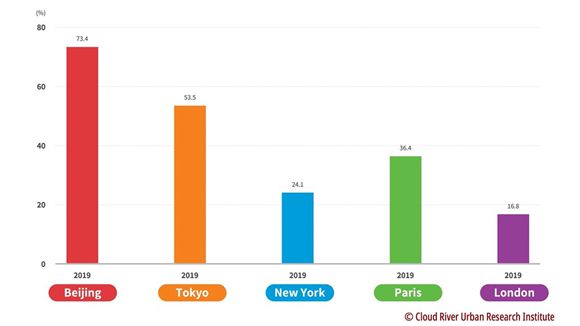
(3) Beijing's carbon intensity is 73.4 percent of the national average level
Beijing's carbon dioxide emissions per unit of GDP are only 73.4 percent of the national average level, taking the lead in the country.
The four major metropolises have a much lower carbon dioxide intensity. Carbon emissions per unit of GDP in Tokyo, Paris, New York and London are only 53.5 percent, 36.4 percent, 24.1 percent and 16.8 percent of their national average levels, respectively.
This set of data reveals that these four cities have an industrial structure better than their national levels, and the agglomeration effect of megacities also shows great advantages in energy conservation and emission reduction.
Figure 8 Comparison between Beijing and the 4 major metropolises in terms of carbon intensity
(share of their national average levels in 2019)


- Kelsang Pedron: A Tibetan female pilot in the Chinese PLA Air Force
- China expands rural land contract extension pilot program
- Fiber chip thinner than a hair
- Ministry to optimize the structure and scale of university enrollment
- Why do China's cultural and creative products go viral?
- Aviation sci-fi park Nantianmen to open in 2027